牛的兄弟 ,你说的很清楚 牛的兄弟 ,你说的很清楚
1 Like
问问为什么x不使用detach函数会报错?
2.5.4中d.backward()应该是d.sum().backward()吧
第5题,不使用d2l封装的函数
import torch

# x.grad.zero_()

# x = torch.rand(2, 4, requires_grad = True)
x = torch.linspace(0, 2 * torch.pi, 100,  requires_grad = True)  # 生成100
y = torch.sin(x)
y.sum().backward()

import numpy as np
import matplotlib.pyplot as plt

from matplotlib_inline import backend_inline

plt.figure(figsize=(8, 8))

plt.plot(x.detach().numpy(), y.detach().numpy(), "-", label="sin(x)")
plt.plot(x.detach().numpy(), x.grad.detach().numpy(), "r--", label="cos(x)")

# x1 = torch.linspace(0, 2 * torch.pi, 200)
# plt.plot(x1.numpy(), torch.zeros_like(x1).numpy(), "--", label="0")

plt.legend(loc='upper left')

# 添加标签和标题
plt.xlabel('X')
plt.ylabel('f(x)')

# 显示图表

plt.show()
I think it’s wrong in some sense.Because of the reshape method does not change the datatype,q still is a tensor.
第5题使用TensorFlow
import numpy as np
import matplotlib.pyplot as plt
import tensorflow as tf
def f(a):
    c = tf.math.sin(a)
    return c

a_values = tf.range(-10.0, 10.0, 0.1)

f_values = []
dx_values = []
with tf.GradientTape(persistent=True) as t:
    for a in a_values:
        a_tensor = tf.constant(a, dtype=tf.float32)
        t.watch(a_tensor)
        y = f(a_tensor)
        f_values.append(y)
        dy_dx = t.gradient(y, a_tensor)
        dx_values.append(dy_dx)

plt.plot(a_values, f_values, label='f(x)')
plt.plot(a_values, dx_values, '--',label='f(x)')
plt.xlabel('x')
plt.legend()
plt.grid()
plt.show()
q4:
def f(a):
b = a*2
if a.norm() > 100:
b = a**2
else:
b = a**3
return b.sum()
a = torch.arange(100,104.,requires_grad=True)
print(a)
b = f(a)
b.backward()
a.grad
q5:
x = torch.arange(0,4.,0.1,requires_grad=True)
y = torch.sin(x)
y.sum().backward()
plot(x, [y, x.grad], ‘f(x)’, ‘x’)
(一个粗浅的理解)pytorch不支持对非标量进行backward。sum可以理解为对f(x)增加了一个复合函数,z=sum(y), 而 dz/dy 是一个单位向量或者单位矩阵,这样不影响最终的结果。
这里z=y.sum(),所以z相对于x的导数应该是
[3x1²,3x2²,3x3²],而不是9x**2
pytorch中这种一维的tensor全都看作列向量,所以结果就是一个列向量
被markdown识别为斜体了
应该是
x = np.linspace(-3*np.pi, 3*np.pi, 100)
1 Like
%matplotlib inline
import numpy as np
from matplotlib_inline import backend_inline
from d2l import torch as d2l
from matplotlib import pyplot as plt
def use_svg_display(): #@save
“”“使用svg格式在Jupyter中显示绘图”“”
backend_inline.set_matplotlib_formats(‘svg’)
def set_figsize(figsize=(3.5, 2.5)): #@save
“”“设置matplotlib的图表大小”“”
use_svg_display()
d2l.plt.rcParams[‘figure.figsize’] = figsize
#@save
def set_axes(axes, xlabel, ylabel, xlim, ylim, xscale, yscale, legend):
“”“设置matplotlib的轴”“”
axes.set_xlabel(xlabel)
axes.set_ylabel(ylabel)
axes.set_xscale(xscale)
axes.set_yscale(yscale)
axes.set_xlim(xlim)
axes.set_ylim(ylim)
if legend:
axes.legend(legend)
axes.grid()
#@save
def plot(X, Y=None, xlabel=None, ylabel=None, legend=None, xlim=None,
ylim=None, xscale=‘linear’, yscale=‘linear’,
fmts=(‘-’, ‘m–’, ‘g-.’, ‘r:’), figsize=(3.5, 2.5), axes=None):
“”“绘制数据点”“”
if legend is None:
legend =
set_figsize(figsize)
axes = axes if axes else d2l.plt.gca()

# 如果X有一个轴,输出True
def has_one_axis(X):
    return (hasattr(X, "ndim") and X.ndim == 1 or isinstance(X, list)
            and not hasattr(X[0], "__len__"))

if has_one_axis(X):
    X = [X]
if Y is None:
    X, Y = [[]] * len(X), X
elif has_one_axis(Y):
    Y = [Y]
if len(X) != len(Y):
    X = X * len(Y)
axes.cla()
for x, y, fmt in zip(X, Y, fmts):
    if len(x):
        axes.plot(x, y, fmt)
    else:
        axes.plot(y, fmt)
set_axes(axes, xlabel, ylabel, xlim, ylim, xscale, yscale, legend)
def function(x):
return np.sin(x)
def derivative(func, x):
h = 1e-7
return (func(x + h) - func(x - h)) / (2 * h)
x = np.arange(-5, 5, 0.001)
y = function(x)
y_derivative = derivative(function, x)
plot(x, [function(x), np.cos(x)], ‘x’, ‘f(x)’, legend=[‘f(x)’, ‘Tangent line (x=1)’])
感觉如果f: R^n → R^m
那f(x).backward(w)是计算dot(w, f(x))对x的梯度
import torch
import d2l
x = torch.arange(-10, 10, 0.05, requires_grad=True)
y = torch.sin(x)
y.backward(torch.ones_like(y))
y_d = x.grad
d2l.torch.plot(x.detach(), [y.detach(), y_d],
‘x’, ‘f(x)’, legend=[‘f(x)=sin(x)’, “f’(x)=cos(x)”],figsize=[5,5])
from d2l import torch as d2l
from math import sin
x = torch.arange(-5, 5, 0.1)
x.requires_grad = True
y = torch.sin(x).sum()
y.backward()
g = x.grad
个人对第五问的看法,不过还是写复杂了呢?其实不用这个backward应该是最方便的,用导数定义来做
x.requires_grad = False
d2l.plot(x, [torch.sin(x), x.grad], ‘x’, ‘f(x)’, legend = [‘sin(x)’, ‘derivative of sin(x)’])
import numpy as np
from matplotlib import pyplot as plt
import math
# 创建需要求梯度的张量 a
a = torch.arange(-2*math.pi, 2*math.pi, 0.01, requires_grad=True)
b = torch.sin(a)  # 计算 sin(a)
c = b.sum()       # 对 b 进行求和
c.backward()      # 计算梯度
# 转换为 NumPy 数组
a_np = a.detach().numpy()
b_np = b.detach().numpy()
# a 的梯度已经在 backward 中计算,现在可以直接使用
a_g_np = a.grad.numpy()
# 绘图

fig, ax = plt.subplots()
ax.plot(a_np, b_np, label='sin(x)')
ax.plot(a_np, a_g_np, label='cos(x)',ls=':')
plt.xticks((-np.pi,-np.pi/2,0,np.pi/2,np.pi),("$-\pi$","$-\\frac{\pi}{2}$","0","$\\frac{\pi}{2}$","$\pi$"))
plt.yticks([-1,0,1])
plt.axis("scaled")
plt.ylim(top=4)
ax.legend()
plt.show()
第五题
y.sum() = x_12 + x_22 +x_3**2
然后对每一个变量求偏导
![]()
Q1: 为什么计算二阶导数比一阶导数的开销要更大?
A1:二阶导数需要在一阶导数基础上再次进行自动微分,自然需要更多资源。
Q2:在运行反向传播函数之后,立即再次运行它,看看会发生什么。
A2:RuntimeError: Trying to backward through the graph a second time (or directly access saved tensors after they have already been freed). Saved intermediate values of the graph are freed when you call .backward() or autograd.grad(). Specify retain_graph=True if you need to backward through the graph a second time or if you need to access saved tensors after calling backward.
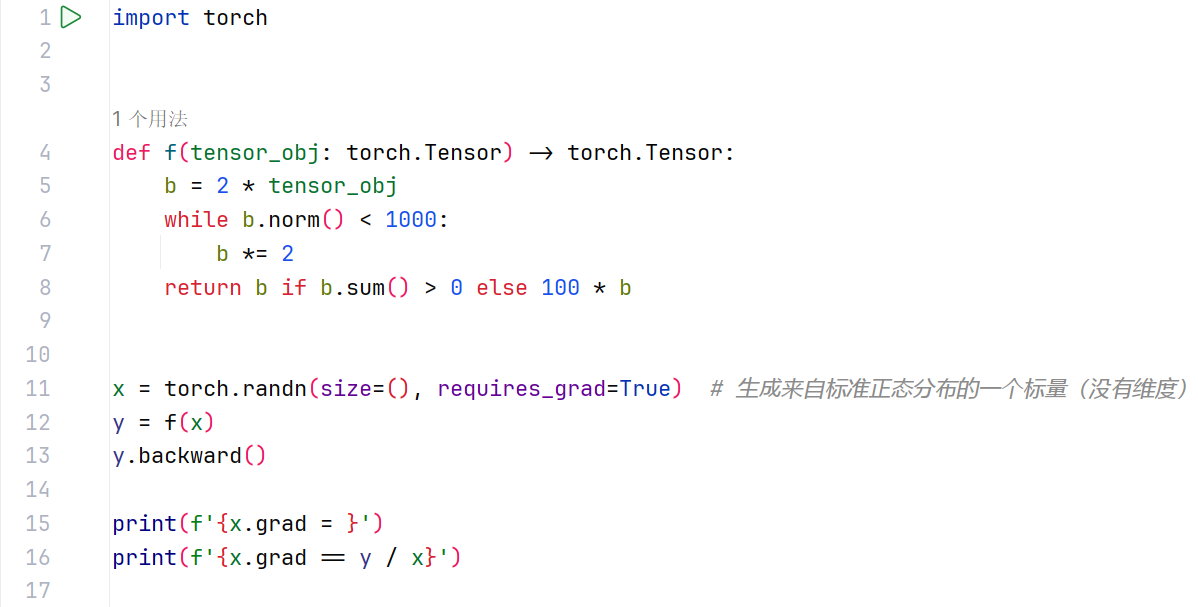
Q3:在控制流的例子中,我们计算d关于a的导数,如果将变量a更改为随机向量或矩阵,会发生什么?
A3:RuntimeError: grad can be implicitly created only for scalar outputs
Q4:重新设计一个求控制流梯度的例子,运行并分析结果
A4:
def f(x):
    if x.sum() > 0:
        return x.sum()
    else:
        return 2*x.sum()
x = torch.tensor([1.0,-1.0],requires_grad=True)
y = f(x)
y.backward()
x.grad
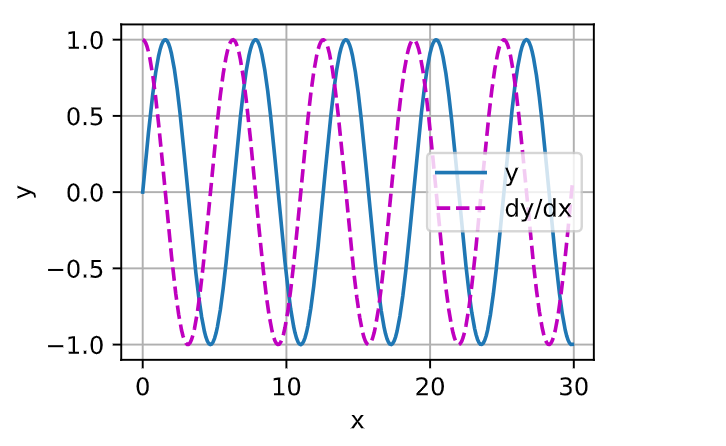
Q5:使f (x) = sin(x),绘制f (x)和 df(x) dx 的图像,其中后者不使用f ′(x) = cos(x)。
A5:
x = torch.arange(0,30,0.1,requires_grad=True)
y1 = torch.sin(x)
y1.sum().backward()
y2 = x.grad
d2l.plot(x.detach(),[y1.detach(),y2.detach()],'x','y',legend=['y','dy/dx'])