自动求导

I got question below:

import torch
x = torch.randn(size=(3,6), requires_grad=True)
t = torch.randn(size=(3,6), requires_grad=True)
y = 2 * torch.dot(x,t)
y.backward()
x.grad
t.grad

I try to create a function of two variable x and t, then do y.backward, but why I got error:

1D tensors expected, but got 2D and 2D tensors

torch.dot() is a function for vector multiply vector, use torch.mm() for matrix multiply matrix

Thanks, it works

Extra question

import torch
x = torch.randn(size=(3,6), requires_grad=True)
t = torch.randn(size=(6,4), requires_grad=True)
y = 2 * torch.mm(x,t)
y.sum().backward()
x.grad
t.grad

tensor([[ 3.3685, 3.3685, 3.3685, 3.3685],
[-4.0740, -4.0740, -4.0740, -4.0740],
[ 5.9460, 5.9460, 5.9460, 5.9460],
[ 0.3694, 0.3694, 0.3694, 0.3694],
[-3.9745, -3.9745, -3.9745, -3.9745],
[-2.2524, -2.2524, -2.2524, -2.2524]])

2 Likes

请问在2.5.4. Python控制流的梯度计算中
a = torch.randn(size=(), requires_grad=True)里面size()是什么意思呢?

这是官方文档里面的

size ( int… ) – a sequence of integers defining the shape of the output tensor. Can be a variable number of arguments or a collection like a list or tuple.

1 Like

感谢回答,就是如果他是(3,4)我能明白他是想生成一个三行四列的矩阵,但是size=()不太明白是什么意思

size=()里面没有数是生成标量,有一个数就是向量,两个就是矩阵。

5 Likes

Thank you very much!!

import torch
import matplotlib.pyplot as plt
import numpy as np
x = torch.linspace(0, 3*np.pi, 128)
x.requires_grad_(True)
y = torch.sin(x)  # y = sin(x)

y.sum().backward()

plt.plot(x.detach(), y.detach(), label='y=sin(x)') 
plt.plot(x.detach(), x.grad, label='∂y/∂x=cos(x)')  # dy/dx = cos(x)
plt.legend(loc='upper right')
plt.show()
1 Like

Hi,
You got this error because the var x and y you created is 2D, and backward() expect a scalar input.

为啥有时会是False啊?误差导致?

可以运行的,不过这里 post 的引号貌似都是中文的,需要自己改成英文引号

首先假设x是一个向量。f(x)对x求偏导数后,每个xi(向量x的分量)都会有自己的偏导数,所以x.grad和x的shape是相同的。如果x是矩阵结果也是一样的。

1 Like

my solution for Question 5:

x = torch.linspace(-5, 5, 100)
x.requires_grad_(True)
y = torch.sin(x)
y.backward(torch.ones_like(x))
y = y.detach()

from utils import d2l
d2l.plot(x.detach(), [y, x.grad], 'f(x)', "f'(x)", legend=['f(x)', 'Tangent line'])
d2l.plt.show()

image

4 Likes

thanks. I run it successful

为什么按照PDF 上的 自动求导 y.backward().会报错。而且我也不理解为什么要求和再求导呢 y.sum().backward()
y 求和之后会是个数字。还怎么求梯度呢。不太理解什么意思。

import math
from d2l import torch as d2l
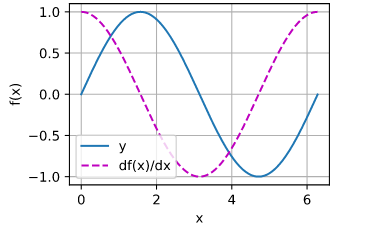
x=torch.arange(0,2*math.pi,0.01,requires_grad=True)
y=torch.sin(x)
y.backward(gradient=torch.ones(len(x)))
d2l.plot(x.detach(),[y.detach(),x.grad],‘x’,‘f(x)’,legend=[‘y’,‘df(x)/dx’])

image

2 Likes

请问样例代码中:

x = torch.arange(4.0)
x
tensor([0., 1., 2., 3.])

求导之后

x.grad
tensor([ 0., 4., 8., 12.])

为什么从14张量求导后还是14,而不是4*1呢? :face_with_monocle:

for Q5:

# using plot function defined in 2.4
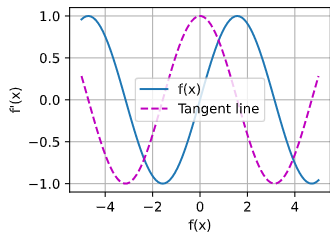
x = torch.arange(-2*torch.pi, torch.pi*2, 0.1,requires_grad=True)
f=torch.sin(x)
f.sum().backward()
f1=x.grad
x.requires_grad_(False)
plot(x, [torch.sin(x), f1], 'x', 'f(x)', legend=['f(x)=sin(x)', "f'(x)=cos(x)"])
3 Likes

关于自动求梯度函数 backward 的使用,这里有一个不错的讲解。

5 Likes