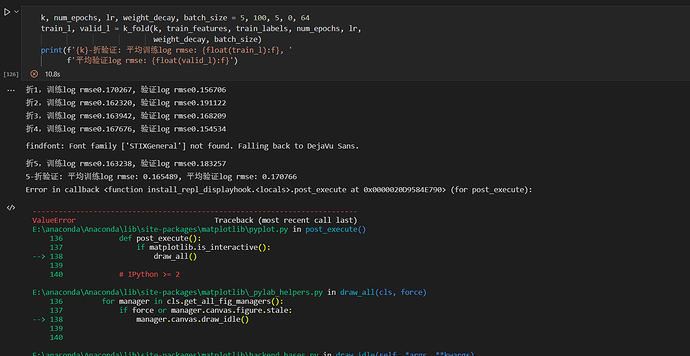
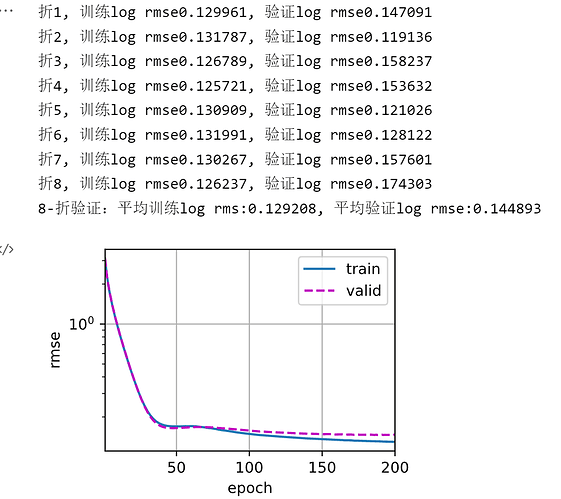
可能是4g的笔记本后来自己加了一根8g的内存条吧。。。
没有找到如何提交到kaggle上,我好菜啊
我觉得是log rmse里面会对数据做截断,没法求导。
请问权值初始化在哪儿呢
是在哪一步集成了吗?
用稀疏矩阵就可了11111111111111111111111
跟之前准确率一样,只是方便人的观察,训练还是用之前的
net = nn.Sequential(nn.Linear(in_features,1)) # 线性层会自动初始化权重w和b
折1,训练log rmsenan, 验证log rmsenan
折2,训练log rmsenan, 验证log rmsenan
折3,训练log rmsenan, 验证log rmsenan
折4,训练log rmsenan, 验证log rmsenan
折5,训练log rmsenan, 验证log rmsenan
5-折验证: 平均训练log rmse: nan, 平均验证log rmse: nan
这是梯度消失了嘛,为什么我的参数都一样,我会一直梯度消失。该怎么调呢
感觉应该是梯度爆炸了,示例代码中的lr设置的是5,我不知道为什么设这么大的lr,调小点可能会好一些
TypeError: linear(): argument ‘input’ (position 1) must be Tensor, not NoneType
不知道为啥我这里的None不能当作tensor进行运算,train_and_pred里面的train会报错,实测把None改为同等形状的空tensor就可以了
train_ls, _ = train(net, train_features, train_labels,None, None,
num_epochs, lr, weight_decay, batch_size)
# train_ls, _ = train(net, train_features, train_labels,torch.empty(train_features.shape), torch.empty(train_labels.shape),
# num_epochs, lr, weight_decay, batch_size)
在把非数值型数据转化成独热编码时,可以换成在每一列用一个数字代表一类,比如该列有三类“红”,“黄”,“蓝”,“红”用1表示,“黄”用2表示,“蓝”用3表示?
拿价格的对数作为loss函数好像结果很不好。平均验证log rmse: 8.059207 ![]()
我的最好成绩是这样的:
k, num_epochs, lr, weight_decay, batch_size = 5, 100, 0.2, 25, 128
多层网络(in_features, 1024)ReLU(1024, 1), 直接loss(net(x), y)
5-折验证: 平均训练log rmse: 0.028177, 平均验证log rmse: 0.135742
另外训练集的损失可以很低,比如这个:
k, num_epochs, lr, weight_decay, batch_size = 10, 800, 0.02, 25, 128
多层网络(in_features, 1024)ReLU(1024, 1), 直接loss(net(x), y)
10-折验证: 平均训练log rmse: 0.007594, 平均验证log rmse: 0.145192
但是验证集的损失仍然在0.14左右,这是不是说明数据集还是太小了?
我试了一下dropout,结果过拟合果然降低了,但是主要是通过升高了训练损失,而验证损失几乎没怎么改善 ![]()
kaggle最好成绩
net = nn.Sequential(nn.Flatten(),
                        nn.Linear(in_features, 1024),
                       nn.ReLU(),
                       nn.Linear(1024, 1))
k, num_epochs, lr, weight_decay, batch_size = 5, 100, 0.1, 35, 256
k, num_epochs, lr, weight_decay, batch_size = 7, 100, 0.1, 0.00001, 128
这个参数能有更好结果,kaggle的public score可以降到5.52295
有没有colab出现这个问题的,请教解决方法
/usr/local/lib/python3.9/dist-packages/matplotlib/_api/init.py in check_getitem(_mapping, **kwargs)
ValueError: ‘svg’ is not a valid value for output; supported values are ‘path’, ‘agg’, ‘macosx’
SEARCH STACK OVERFLOW
是d2l 里面這句不行, 把svg 改成png 就好了
backend_inline.set_matplotlib_formats(‘svg’)
加入下面的代碼, 把k_fold里面的d2l.plot 改為指向本地的plot就好了
from matplotlib_inline import backend_inline
def set_figsize(figsize=(3.5, 2.5)):
    """Set the figure size for matplotlib.

    Defined in :numref:`sec_calculus`"""
    backend_inline.set_matplotlib_formats('png')
    d2l.plt.rcParams['figure.figsize'] = figsize

def plot(X, Y=None, xlabel=None, ylabel=None, legend=None, xlim=None,
         ylim=None, xscale='linear', yscale='linear',
         fmts=('-', 'm--', 'g-.', 'r:'), figsize=(3.5, 2.5), axes=None):
    """Plot data points.

    Defined in :numref:`sec_calculus`"""
    if legend is None:
        legend = []

    set_figsize(figsize)
    axes = axes if axes else d2l.plt.gca()

    # Return True if `X` (tensor or list) has 1 axis
    def has_one_axis(X):
        return (hasattr(X, "ndim") and X.ndim == 1 or isinstance(X, list)
                and not hasattr(X[0], "__len__"))

    if has_one_axis(X):
        X = [X]
    if Y is None:
        X, Y = [[]] * len(X), X
    elif has_one_axis(Y):
        Y = [Y]
    if len(X) != len(Y):
        X = X * len(Y)
    axes.cla()
    for x, y, fmt in zip(X, Y, fmts):
        if len(x):
            axes.plot(x, y, fmt)
        else:
            axes.plot(y, fmt)
    d2l.set_axes(axes, xlabel, ylabel, xlim, ylim, xscale, yscale, legend)


