def experiment_fig(n, m):
counts = torch.from_numpy(np.random.multinomial(n, fair_probs, size=m))
cum_counts = counts.type(torch.float32).cumsum(axis=0)
estimates = cum_counts / cum_counts.sum(axis=1, keepdims=True)
d2l.set_figsize((6, 4.5))
for i in range(6):
d2l.plt.plot(estimates[:, i].numpy(),
label=("P(die=" + str(i + 1) + ")"))
d2l.plt.axhline(y=0.167, color='black', linestyle='dashed')
d2l.plt.gca().set_xlabel('Groups of experiments')
d2l.plt.gca().set_ylabel('Estimated probability')
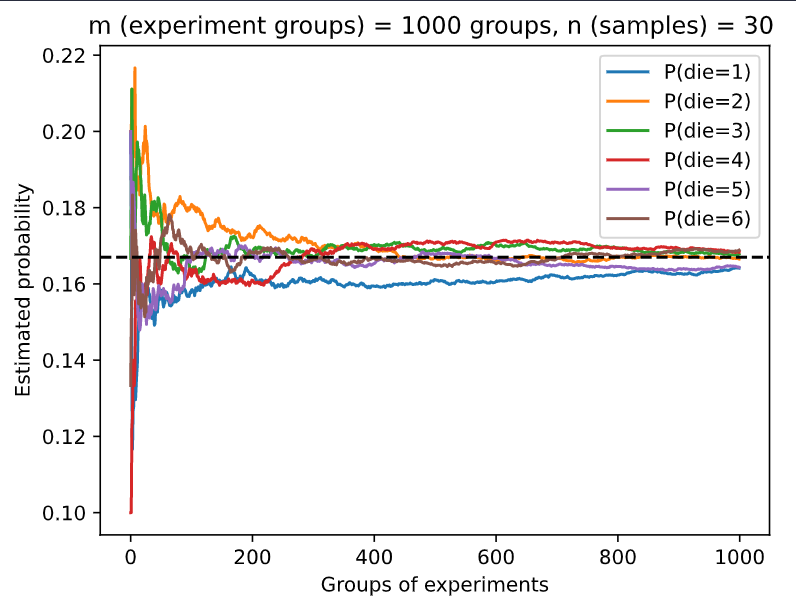
d2l.plt.title(f'm (experiment groups) = {m} groups, n (samples) = {n} ')
d2l.plt.legend()
experiment_fig(30, 1000)
- “2.6” repeated!
In Section 2.6, the first test is more accurate. Why not just run the first test a second time?
- I’m not sure about answer.
- Maybe we just want to know Probability by repeating 1000 times’ frequency, according to law of large numbers.

Couple things:
You can import Multinomial directly from torch.distributions. ie. from torch.distributions import Multinomial
distribution.sample() takes a sample_size argument. So instead of sampling from numpy and converting into pytorch you can simply say Multinomial(10, fair_probs).sample((3,)) (sample_shape needs to be tuple).
Hello, Preformatted text I have a question about question 3 (Markov Chain), I’m not sure about my answer:
P(A,B,C) = P(C|B,C)P(B,C) = P(C|B,A)P(B|A)P(A)
as A,B,C states have Markov chain property, P(C|B,A) = P(C|B)
P(A,B,C) = P(C|B)P(B|A)P(A)
thanks in advance 
Hi @Emanuel_Afanador, since 𝐵 only depends on 𝐴, and 𝐶 only depends on 𝐵, then
$P(A, B, C) = P(C | A, B) * P(A, B) = P(C | A, B) * [P(B | A) * P(A)] $ .
Wonder anyone has encountered the same problem as me related to the code above. In version 0.7 of Dive into Deep Learning, the code works as shown above, with all the probabilities converging to the expected value of 1/6. However, with code in version 0.8.0 of the same book, the curves (see the image on the right) do not look right. Both curves were obtained by running the code from the book(s) without any changes and ran on the same PC. So there might be bugs in version 0.8.0 of the book? Thanks!

Maybe it is just a coincidence that almost 90 groups of experiments is “die = 6”?
It would be more clear if you counts / 1000 # Relative frequency as the estimate.
In L2/5 Naive Bayes, in terms of Nvidia Turing GPUs, why Alex said adding more silicons is almost free for Nvidia?
Hi @ness001, great question! Check here for more details about GPUs 13.4. Hardware — Dive into Deep Learning 1.0.3 documentation
for question #3 can we calculate it like this :
P(A,B,C) = P(A/B,C) * P(B,C) and as B not depend on c
P(A,B,C) = P(A/B,C)*P(B)*P©
is it correct like this or not ? if not could you please explain why?
thanks in davaned
For Q4:
If we do the test 1 twice, the two tests won’t be independent, since they are using the same method on the same patient. In fact, we will get the same result very possibly.
For Q3
P(ABC)=P(C|AB)P(AB)=P(C|B)P(B|A)P(A)
is it right? is it the simplest answer for Q3?
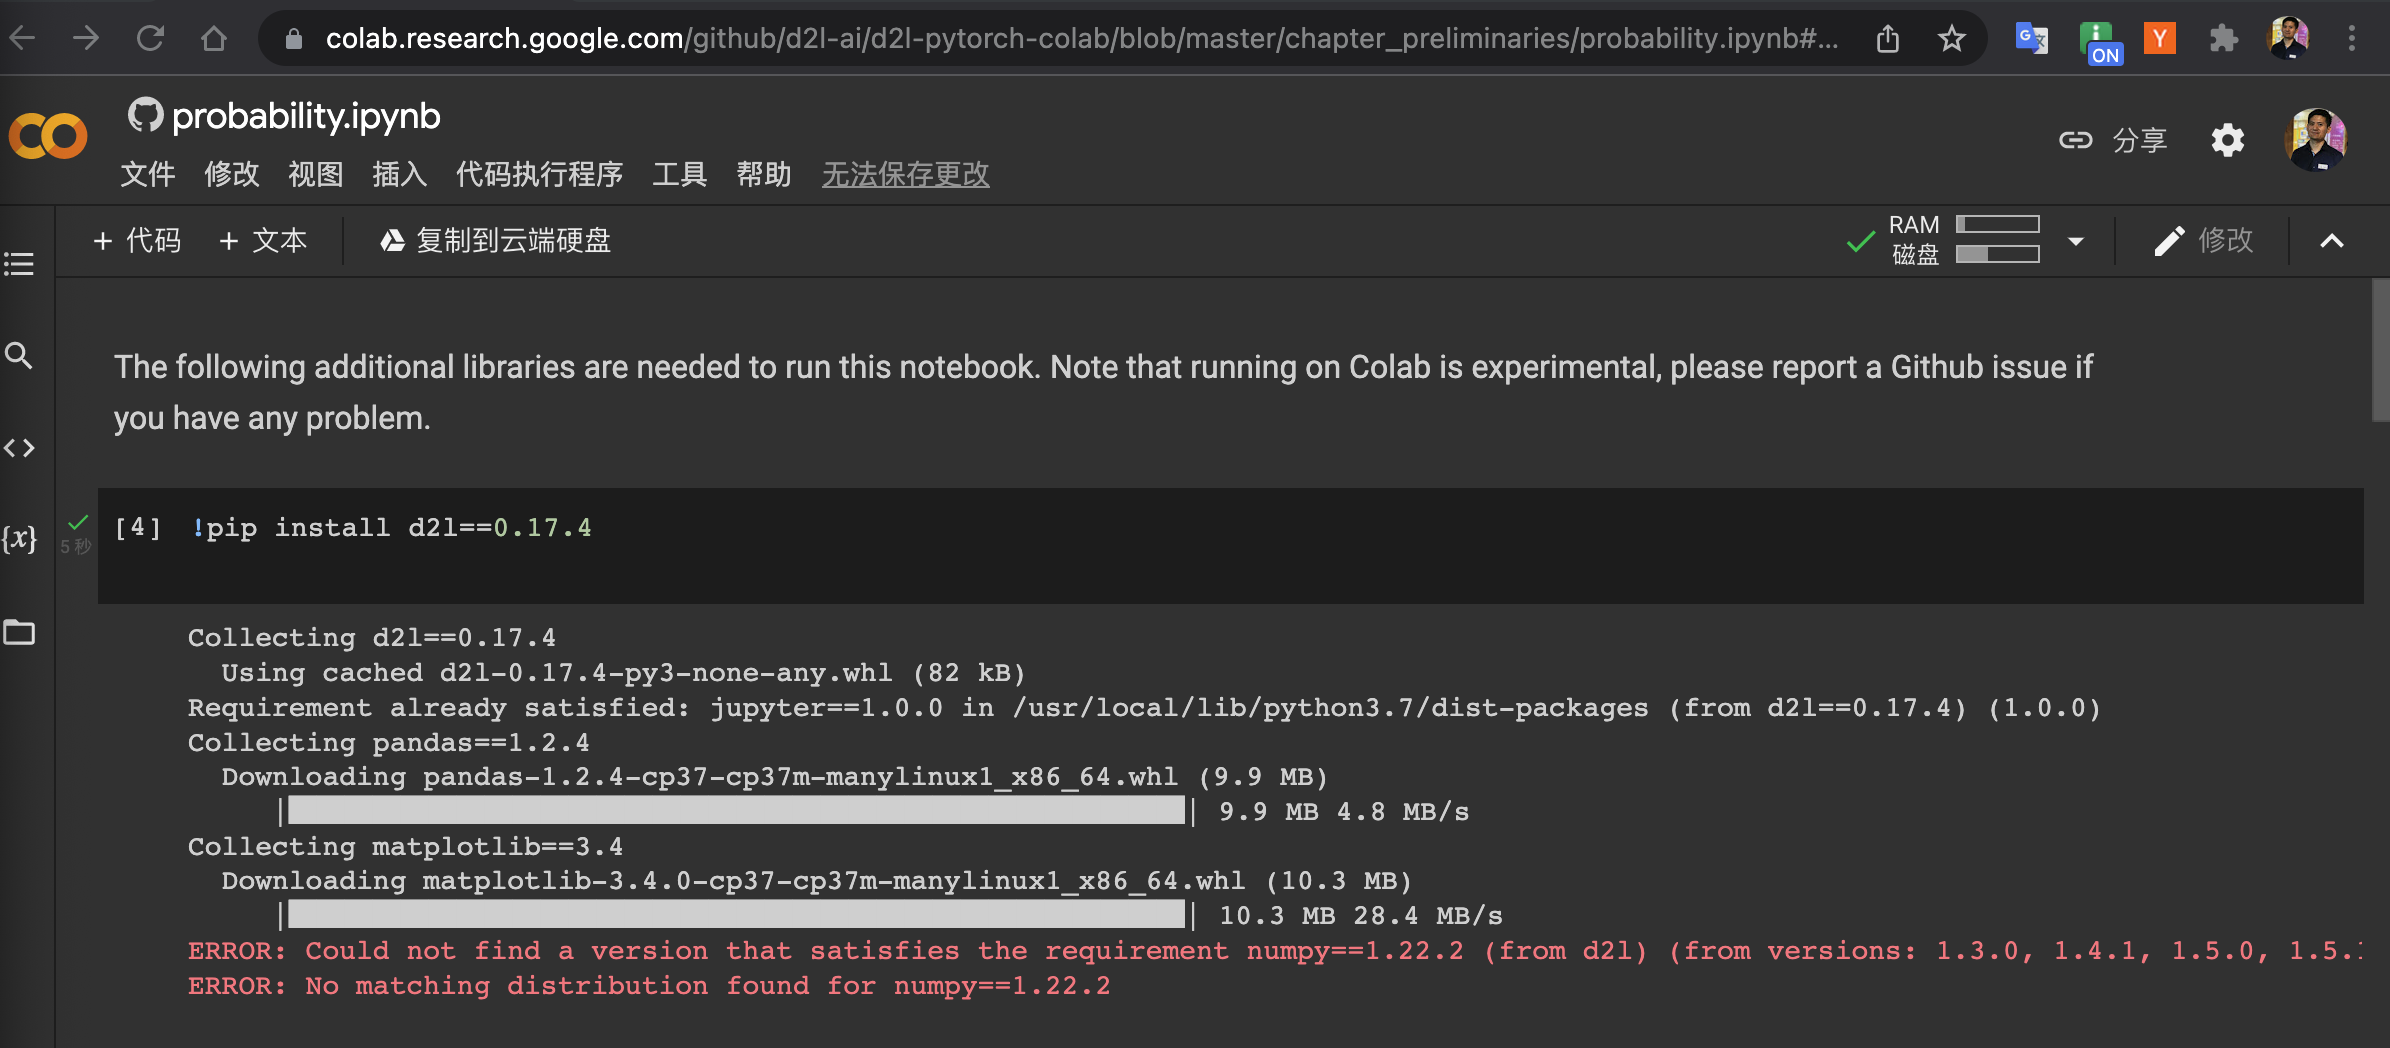
Can you try !pip install d2l, I succeeded, and where did you get this 0.17.4 version?
It does work. I use pytorch in colab. Thank you so much.
In section 2.6.2.6
P(D1=1,D2=1) = P(D1=1,D2=1|H=0) * P(H=0) + P(D1=1,D2=1|H=1) * P(H=1)
Is this equivalent to (since D1 and D2 are independent)
P(D1=1,D2=1) = P(D1=1) * P(D2=1) ?
P(D1=1) has been calculated in equation 2.6.3 and P(D2=1) can be calculated similarly.
I am having a hard time proving this. Am I missing something?
“…by assuming the conditional independence”
my bad.
Maybe there’s a typo in 2.6.7 which should be 0.00176655 and I have 0.8321304237 in 2.6.8. Correct?