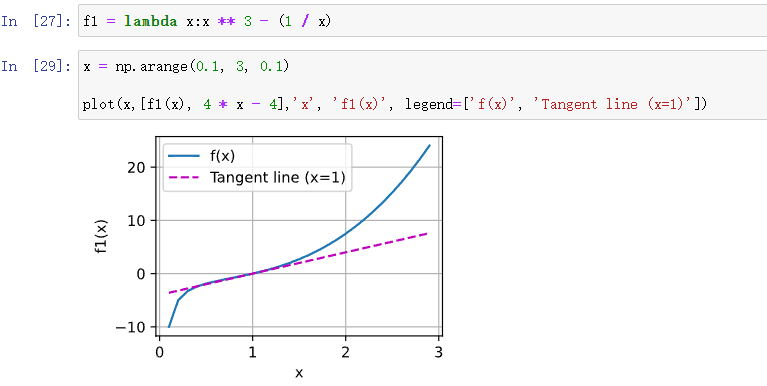
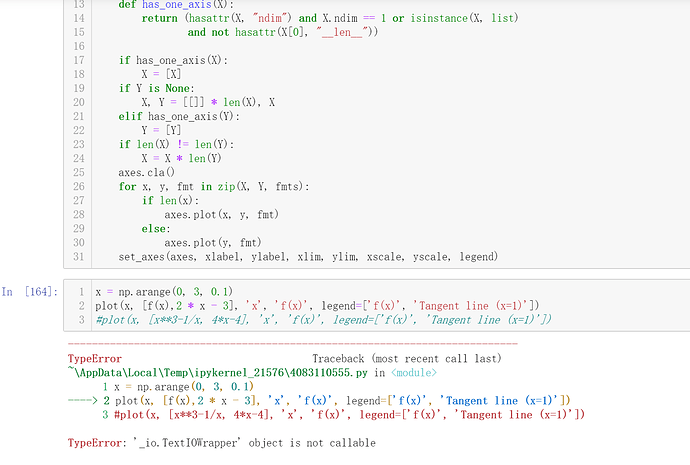
运行没问题 但是怎么没有plot窗口弹出?
def f(x):
return x**3-1/x
x = np.arange(0.1,3,0.1)
plot(x, [f(x), 4*x-4], legend=[‘f(x)’, ‘Tangent line (x=1)’])
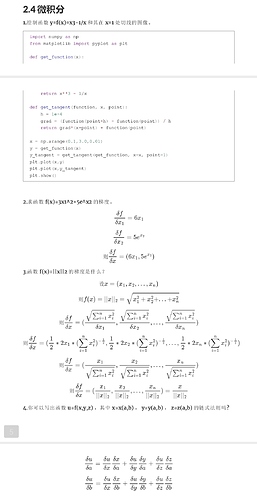
[6x_1, 5e^{x_2}]
x/||x||_2
df/da = df/dxdx/da + df/dydy/da + df/dzdz/da
df/db = df/dxdx/db + df/dydy/db + df/dzdz/db
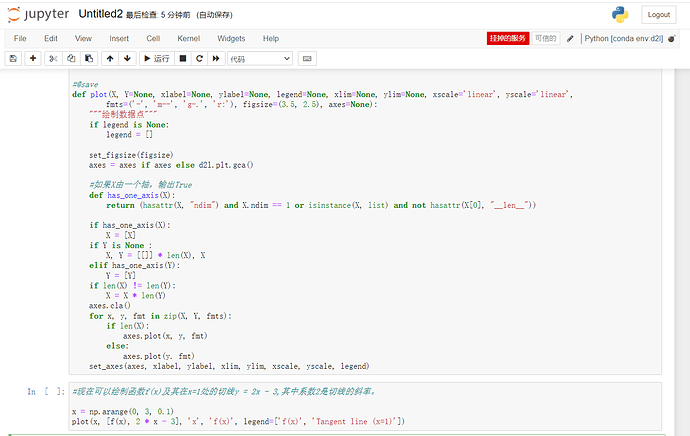
return (hasattr(X, “ndim”) and X.ndim == 1 or isinstance(X, list)
and not hasattr(X[0], “len”))
有点不了解这里面的内容,以及这个想表达什么,达到什么效果,有没有大佬帮忙解释下
分母是标量,分子是向量,这个就是最终解了。
我觉得这个是因为默认向量都是列向量 如果指出其是一个行向量 应该加一个转置符号
你的问题解决了吗?
我也是程序运行没问题,可就是没有弹出来画图窗口。
我是把程序拷下来,自己写了个 .py 来运行的。
求助大神,
我是把代码拷下来,自己写了个.py来运行的,运行未报错,可就是不弹出画图的视窗,谁知道什么问题?
我的源代码贴图如下:
as following code is going to import essential library.
import collections
import hashlib
import math
import os
import random
import re
import shutil
import sys
import tarfile
import time
import zipfile
from collections import defaultdict
import pandas as pd
import requests
from IPython import display
from matplotlib import pyplot as plt
from matplotlib_inline import backend_inline
as above is the essential libary.
as below is the not essential libraty loading
import torch
import numpy as np
import torchvision
from PIL import Image
from torch import nn
from torch.nn import functional as F
from torch.utils import data
from torchvision import transforms
as above is not the essential library loading
as following is the real code start.
as following is to try the plotting coding
def f(x):
print(‘Ffunction done’)
return 3x**2 - 4x
def use_svg_display():
backend_inline.set_matplotlib_formats(‘svg’)
print(‘use svg display is done’)
def set_figsize(figsize=(3.5, 2.5)):
use_svg_display()
plt.rcParams[‘figure.figsize’] = figsize
print(‘set figsize is done’)
#save
def set_axes(axes, xlabel, ylabel, xlim, ylim, xscale, yscale, legend):
axes.set_xlabel(xlabel)
axes.set_ylabel(ylabel)
axes.set_xscale(xscale)
axes.set_yscale(yscale)
axes.set_xlim(xlim)
axes.set_ylim(ylim)
if legend:
axes.legend(legend)
axes.grid()
print(‘set axes is done’)
#save
def plot(X, Y=None, xlabel=None, ylabel=None, legend=None, xlim=None,
ylim=None, xscale=‘linear’, yscale=‘linear’,
fmts=(’-’, ‘m–’, ‘g-.’, ‘r:’), figsize=(3.5, 2.5), axes=None):
if legend is None:
legend = []
set_figsize(figsize)
print('set fig size done')
axes = axes if axes else plt.gca()
print('get axes done')
def has_one_axis(X):
    return (hasattr(X, "ndim") and X.ndim == 1 or isinstance(X, list)
            and not hasattr(X[0], "__len__"))
if has_one_axis(X):
    X = [X]
    print('x has one axis')
if Y is None:
    X, Y = [[]] * len(X), X
    print('Y is none')
elif has_one_axis(Y):
    Y = [Y]
    print('y has one axis')
if len(X) != len(Y):
    X = X * len(Y)
    print('x and y len is not same')
axes.cla()
for x, y, fmt in zip(X, Y, fmts):
    if len(x):
        axes.plot(x, y, fmt)
        print('len(x)is not 0')
    else:
        axes.plot(y, fmt)
        print('len(x) is 0')
set_axes(axes, xlabel, ylabel, xlim, ylim, xscale, yscale, legend)
print('plot function is done')
x = np.arange(0, 3, 0.1)
plot(x, [f(x), 2 * x - 3], ‘x’, ‘f(x)’, legend=[‘f(x)’, ‘Tangent line (x=1)’])
print(‘finished’)
自己找到解决办法 了:
加一句: plt.show()
偏导中不是变量的部分被认为是常数,所以第一个里面只剩下6x1, 5e^x2相当于常数,常数的微分等于0
题目不是x^2是x_2,2是下标。。。。。
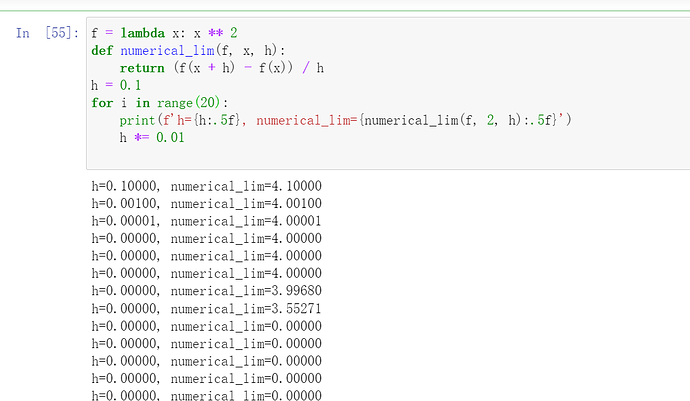
python格式化输出,.5f表示保留五位小数,多次迭代后数太小了,前五位小数都是0
因为只保留了5位小数,后边的太小了,所以你这显示都是0
想问一下为什么Y=NONE的时候,要X, Y = [[]] * len(X), X这样做呢?
