https://d2l.ai/chapter_reinforcement-learning/qlearning.html
1 Like
https://d2l.ai/chapter_reinforcement-learning/qlearning.html
When I click on this URL I get redirected to the homepage, does it mean it is not published yet? Is there a way I can see it anyway?
1 Like
Looking forward to the DQN chapter.
Coming from the MITx’s McroMasters series on Stats and Probability a year ago, I can still understand (mostly) what’s going on.
Great work. Thank you.
1 Like
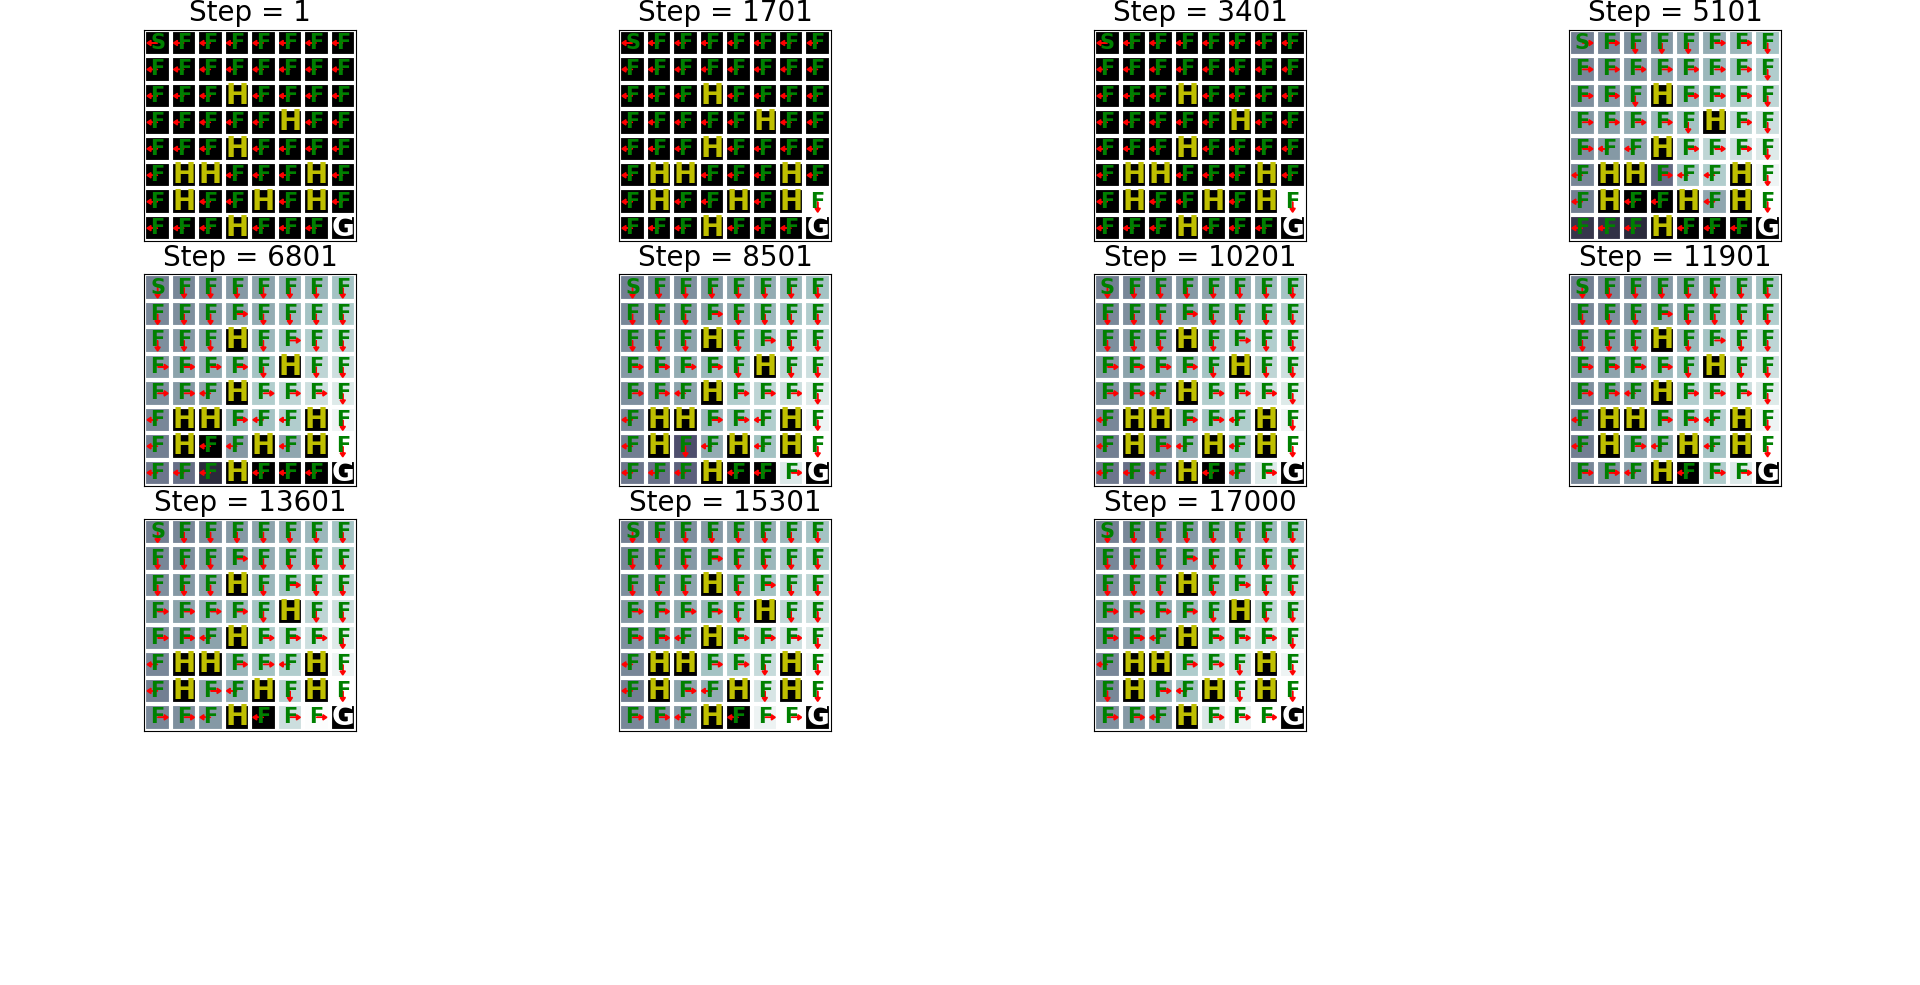
For convenience, these 2 functions should make it easy to switch into 8x8. Param “size” expects either “4x4” or “8x8”. These 2 functions exist within torch: i just copied them out and adapted for my own use.
Everything else kept the same: A 4 times increase in lake area resulted in an increase of iterations (to reach something usable), from 256 to about 17000, a 66 times increase. Even then, the bottom left area is clearly not optimal.
def frozen_lake_sizeable(seed, size):

    """Defined in :numref:`sec_utils`"""
    # See https://www.gymlibrary.dev/environments/toy_text/frozen_lake/ to learn more about this env
    # How to process env.P.items is adpated from https://sites.google.com/view/deep-rl-bootcamp/labs

    import gym
    env = gym.make('FrozenLake-v1', is_slippery=False, map_name=size)
    env.seed(seed)
    env.action_space.np_random.seed(seed)
    env.action_space.seed(seed)
    env_info = {}
    env_info['desc'] = env.desc  # 2D array specifying what each grid item means
    env_info['num_states'] = env.nS  # Number of observations/states or obs/state dim
    env_info['num_actions'] = env.nA  # Number of actions or action dim

    # Define indices for (transition probability, nextstate, reward, done) tuple
    env_info['trans_prob_idx'] = 0  # Index of transition probability entry
    env_info['nextstate_idx'] = 1  # Index of next state entry
    env_info['reward_idx'] = 2  # Index of reward entry
    env_info['done_idx'] = 3  # Index of done entry
    env_info['mdp'] = {}
    env_info['env'] = env

    for (s, others) in env.P.items():
        # others(s) = {a0: [ (p(s'|s,a0), s', reward, done),...], a1:[...], ...}
        for (a, pxrds) in others.items():
            # pxrds is [(p1,next1,r1,d1),(p2,next2,r2,d2),..].
            # e.g. [(0.3, 0, 0, False), (0.3, 0, 0, False), (0.3, 4, 1, False)]
            env_info['mdp'][(s,a)] = pxrds
    return env_info

def show_Q_function_progress(env_desc, V_all, pi_all, size):

    """Defined in :numref:`sec_utils`"""
    # This function visualizes how value and policy changes over time.
    # V: [num_iters, num_states]
    # pi: [num_iters, num_states]

    from matplotlib import pyplot as plt
    if size == "4x4":
        side = 4
    if size == "8x8":
        side = 8
    # We want to only shows few values
    num_iters_all = V_all.shape[0]
    num_iters = num_iters_all // 10
    vis_indx = np.arange(0, num_iters_all, num_iters).tolist()
    vis_indx.append(num_iters_all - 1)
    V = np.zeros((len(vis_indx), V_all.shape[1]))
    pi = np.zeros((len(vis_indx), V_all.shape[1]))
    for c, i in enumerate(vis_indx):
        V[c]  = V_all[i]
        pi[c] = pi_all[i]
    num_iters = V.shape[0]
    fig, ax = plt.subplots(figsize=(15, 15))
    for k in range(V.shape[0]):
        plt.subplot(4, 4, k + 1)
        plt.imshow(V[k].reshape(side, side), cmap="bone")
        ax = plt.gca()
        ax.set_xticks(np.arange(0, side+1)-.5, minor=True)
        ax.set_yticks(np.arange(0, side+1)-.5, minor=True)
        ax.grid(which="minor", color="w", linestyle='-', linewidth=3)
        ax.tick_params(which="minor", bottom=False, left=False)
        ax.set_xticks([])
        ax.set_yticks([])

        # LEFT action: 0, DOWN action: 1
        # RIGHT action: 2, UP action: 3
        action2dxdy = {0:(-.25, 0),1:(0, .25),
                       2:(0.25, 0),3:(-.25, 0)}

        for y in range(side):
            for x in range(side):
                action = pi[k].reshape(side, side)[y, x]
                dx, dy = action2dxdy[action]
                if env_desc[y,x].decode() == 'H':
                    ax.text(x, y, str(env_desc[y,x].decode()),
                       ha="center", va="center", color="y",
                         size=20, fontweight='bold')
                elif env_desc[y,x].decode() == 'G':
                    ax.text(x, y, str(env_desc[y,x].decode()),
                       ha="center", va="center", color="w",
                         size=20, fontweight='bold')
                else:
                    ax.text(x, y, str(env_desc[y,x].decode()),
                       ha="center", va="center", color="g",
                         size=15, fontweight='bold')

                # No arrow for cells with G and H labels
                if env_desc[y,x].decode() != 'G' and env_desc[y,x].decode() != 'H':
                    ax.arrow(x, y, dx, dy, color='r', head_width=0.2, head_length=0.15)
        ax.set_title("Step = "  + str(vis_indx[k] + 1), fontsize=20)
    fig.tight_layout()
    plt.show()
1 Like
Thank you for the feedback and glad that you found our RL chapters useful.
Sure, DQN will be coming in a few weeks.
Yes, the number of training steps increases as state space gets larger. epsilon and alpha might need to be changed for a larger version of this problem. In general, model-free methods have very high sample complexity.
We’ll definitely make our codes more flexible so it can better visualize larger size grids. Also, thank you for your code snippet.
Rasool
1 Like
Glad to know that DQN is on the way! Thanks for your contribution.
May I know what you will or plan to present in the whole RL chapter for the final version? That will be helpful since I would like to schedule or learn in advance.
there is a bug when running the following code in colab.
Now set up the environment
env_info = d2l.make_env(‘FrozenLake-v1’, seed=seed)
bug is as follow.
AttributeError: ‘FrozenLakeEnv’ object has no attribute ‘nS’
1 Like
the reinforcement learning part is a bit too compact… still wish to see DQN
Excellent content! I just have slight ambiguity in the sign in eq. 17.3.3; shouldn’t alpha be preceded with + in second term of the equation? Similarly in 17.3.4.
Yes, the RL part won’t run.
First of all, I have to manually install ‘gym’, it’s not part of the environment set up for the book overall.
Secondly, even after doing that, get this error:
AttributeError Traceback (most recent call last)
Cell In[3], line 13
10 np.random.seed(seed)
12 # Now set up the environment
—> 13 env_info = d2l.make_env(‘FrozenLake-v1’, seed=seed)
File /usr/local/lib/python3.10/site-packages/d2l/torch.py:2852, in make_env(name, seed)
2848 # Input parameters:
2849 # name: specifies a gym environment.
2850 # For Value iteration, only FrozenLake-v1 is supported.
2851 if name == ‘FrozenLake-v1’:
→ 2852 return frozen_lake(seed)
2854 else:
2855 raise ValueError(“%s env is not supported in this Notebook”)
File /usr/local/lib/python3.10/site-packages/d2l/torch.py:2821, in frozen_lake(seed)
2818 import gym
2820 env = gym.make(‘FrozenLake-v1’, is_slippery=False)
→ 2821 env.seed(seed)
2822 env.action_space.np_random.seed(seed)
2823 env.action_space.seed(seed)
File /usr/local/lib/python3.10/site-packages/gym/core.py:241, in Wrapper.getattr(self, name)
239 if name.startswith(“_”):
240 raise AttributeError(f"accessing private attribute ‘{name}’ is prohibited")
→ 241 return getattr(self.env, name)
File /usr/local/lib/python3.10/site-packages/gym/core.py:241, in Wrapper.getattr(self, name)
239 if name.startswith(“_”):
240 raise AttributeError(f"accessing private attribute ‘{name}’ is prohibited")
→ 241 return getattr(self.env, name)
File /usr/local/lib/python3.10/site-packages/gym/core.py:241, in Wrapper.getattr(self, name)
239 if name.startswith(“_”):
240 raise AttributeError(f"accessing private attribute ‘{name}’ is prohibited")
→ 241 return getattr(self.env, name)
AttributeError: ‘FrozenLakeEnv’ object has no attribute ‘seed’
Equation 17.3.3 should be Q = (1-alpha) * Q + alpha * (r + gamma * Q’), right? And same for the next equation.
1 Like