1, 2, partly 3th
I implemented pReLU as
def prelu(x, alpha):
    return np.maximum(0,x)+np.minimum(0,alpha*x)
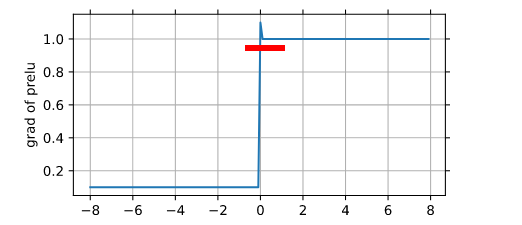
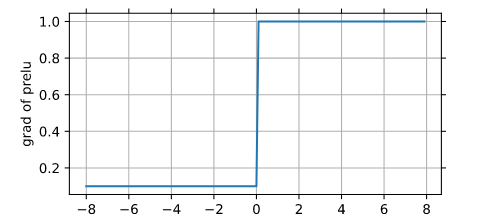
But there is some interesting bug with grad of prelu (alpha=0.1):

It can be fixed by shifting 0 in maximum:
def prelu(x, alpha):
    return np.maximum(0,x)+np.minimum(-1e-30,alpha*x)

But is there a simpler and safer solution?
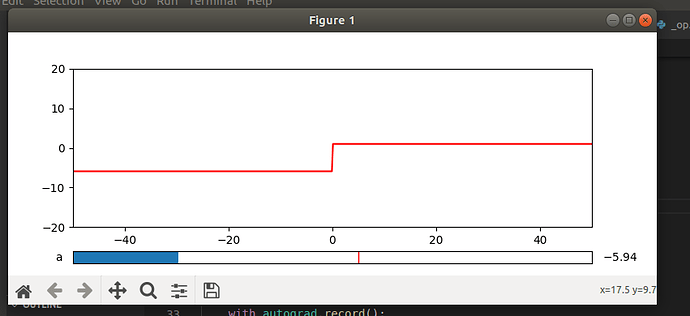
that’s my answer for pRELU
from d2l import mxnet as d2l
from mxnet import np,npx ,autograd
from matplotlib.widgets import Slider, Button
import matplotlib.pyplot as plt
npx.set_np()
a_min = 0    # the minimial value of the paramater a
a_max = 10   # the maximal value of the paramater a
a_init = 1   # the value of the parameter a to be used initially, when the graph is created

x = np.linspace(-50,50 , 500)
x.attach_grad()
fig = plt.figure(figsize=(8,3))

# first we create the general layount of the figure
# with two axes objects: one for the plot of the function
# and the other for the slider
prelu= plt.axes([0.1, 0.2, 0.8, 0.65])
slider_ax = plt.axes([0.1, 0.05, 0.8, 0.05])
plt.axes(prelu)
with autograd.record():

    u=a_init*np.minimum(0,x)+np.maximum(0,x)
u.backward()
z,= plt.plot(x, x.grad, 'r')
plt.xlim(-50, 50)
plt.ylim(-20, 20)


# the final step is to specify that the slider needs to
# execute the above function when its value changes
v=Slider(slider_ax,'a',-10,10,valinit= a_init)
def update(a):
    with autograd.record():

        u=a*np.minimum(0,x)+np.maximum(0,x)
    u.backward()
    z.set_ydata(x.grad) # set new y-coordinates of the plotted points
    fig.canvas.draw_idle()
v.on_changed(update)
d2l.plt.show()

