Data Preprocessing

If the author wants to suggest pandas, then they should invoke more of the pandas API

inputs = data[['NumRooms', 'Alley']] # dataframe
outputs = data['Price'] # series

Also, calling mean on a whole dataframe will call a future warning unless you specify the operation is on numeric data

inputs.mean(numeric_only=True)

It doesn’t affect these examples, but readers should be aware of this.

You can call them directly as a series then numpy array.

# convert column to tensor
array = data[column_name]
tensor = torch.tensor(array)

By assuming we only want to drop input columns:

data = pd.read_csv(data_file)
inputs, outputs = data.iloc[:, 0:2], data.iloc[:, 2]
nas = inputs.isna().astype(int)
column_index = nas.sum(axis = 0).argmax()
inputs = inputs.drop(inputs.columns[column_index], axis=1)
inputs

Two line code

missingMostColumnIndex = data.count().argmin()
data.drop(columns=data.columns[missingMostColumnIndex])

1. Try loading datasets, e.g., Abalone from the UCI Machine Learning Repository and inspect their properties. What fraction of them has missing values? What fraction of the variables is numerical, categorical, or text?

abalone_data = pd.read_csv("../data/chap_2/abalone.data", 
                           names = [
                               "sex", "length", "diameter", "height", 
                               "whole_weight", "shucked_weight",
                               "viscera_weight", "shell_weight",
                               "rings"
                           ]
                          )

abalone_data.describe(include = "all")
sex length diameter height whole_weight shucked_weight viscera_weight shell_weight rings
count 4177 4177.000000 4177.000000 4177.000000 4177.000000 4177.000000 4177.000000 4177.000000 4177.000000
unique 3 NaN NaN NaN NaN NaN NaN NaN NaN
top M NaN NaN NaN NaN NaN NaN NaN NaN
freq 1528 NaN NaN NaN NaN NaN NaN NaN NaN
mean NaN 0.523992 0.407881 0.139516 0.828742 0.359367 0.180594 0.238831 9.933684
std NaN 0.120093 0.099240 0.041827 0.490389 0.221963 0.109614 0.139203 3.224169
min NaN 0.075000 0.055000 0.000000 0.002000 0.001000 0.000500 0.001500 1.000000
25% NaN 0.450000 0.350000 0.115000 0.441500 0.186000 0.093500 0.130000 8.000000
50% NaN 0.545000 0.425000 0.140000 0.799500 0.336000 0.171000 0.234000 9.000000
75% NaN 0.615000 0.480000 0.165000 1.153000 0.502000 0.253000 0.329000 11.000000
max NaN 0.815000 0.650000 1.130000 2.825500 1.488000 0.760000 1.005000 29.000000
  • There are no items with missing values
  • 8 out of 9 attributes are numerical, last is object

2. Try out indexing and selecting data columns by name rather than by column number. The pandas documentation on indexing has further details on how to do this.

abalone_data[["sex", "rings", "length"]][ : 20]
sex rings length
0 M 15 0.455
1 M 7 0.350
2 F 9 0.530
3 M 10 0.440
4 I 7 0.330
5 I 8 0.425
6 F 20 0.530
7 F 16 0.545
8 M 9 0.475
9 F 19 0.550
10 F 14 0.525
11 M 10 0.430
12 M 11 0.490
13 F 10 0.535
14 F 10 0.470
15 M 12 0.500
16 I 7 0.355
17 F 10 0.440
18 M 7 0.365
19 M 9 0.450

3.How large a dataset do you think you could load this way? What might be the limitations? Hint: consider the time to read the data, representation, processing, and memory footprint. Try this out on your laptop. What changes if you try it out on a server?

  1. How large?
    • Depends on the amount of RAM your system has, mine starts struggling at around 8,00,000 records of text data
  2. What changes on server?
    • If you were using HDD on your machine and SSD on your cloud machine instance/server, you might notice better load times
    • Or you might see significantly worse performance since you’re usign free version which has barely more RAM than your machine and uses an HDD to boot :stuck_out_tongue:

4. How would you deal with data that has a very large number of categories? What if the category labels are all unique? Should you include the latter?

  • If too many categories, try to manually find catgories that are common to each other and group them as one. If they’re all far too different from each other, you’re most likely out of luck, or you can take the information hit and still do the merging of categories to the extent possible

  • If the categories are all unique, meaning number of categories == number of samples in dataset, just drop the column, since the column is carrying no useful information, just like a column that only has 1 value. All values are different(if all unique) or same(if all same) no matter the value of the rest of the attributes, there is no pattern to be found here

5. What alternatives to pandas can you think of? How about loading NumPy tensors from a file? Check out Pillow, the Python Imaging Library.

Just one word : dask :smile:

Create a raw dataset with more rows and columns:
a= [str(x)+’,NA’ for x in list(np.random.randint(0,4, 1000))]
b =[str(y) for y in list(np.random.randint(0,178000, 1000))]
z=[x+’,’+y+’\n’ for (x,y) in zip(a, b)]
with open(data_file, ‘w’) as f:
f.write(‘NumRooms,Alley,Price\n’) # Column names
for x in z:
f.write(x)

  1. Delete the column with the most missing values.
    d_ict= dict(data.isnull().sum())
    max_value = max(d_ict, key=d_ict.get)
    data.drop(max_value, axis=1)

  2. Convert the preprocessed dataset to the tensor format.
    outputs, inputs = data.iloc[:,1], data.loc[:,[‘NumRooms’, ‘Price’]]
    X, y = torch.tensor(inputs.values), torch.tensor(outputs.values)
    X, y

column_names = [“sex”, “length”, “diameter”, “height”, “whole weight”, “shucked weight”, “viscera weight”, “shell weight”, “rings”]
df = pd.read_csv(‘abalone.data’,names=column_names)
print(“Number of samples: %d” % len(df))

df.isna().sum() #Missing values

Catgorical and numerical types
df_numerical = df.select_dtypes(exclude=‘object’)
df_categorical = df.select_dtypes(include=‘object’)

df_numerical_cols = df_numerical.columns.tolist()
df_categorical_cols = df_categorical.columns.tolist()

Indexing can be done:
df.iloc[:,2:][:20]

Ex1.

!wget https://archive.ics.uci.edu/static/public/1/abalone.zip
!unzip abalone.zip
import pandas as pd
attr_names = (
    "Sex", "Length(mm)", "Diameter(mm)", "Height(mm)", "Whole_weight(g)", "Shucked_weight(g)", "Viscera_weight(g)", "Shell_weight(g)", "Rings"
)
# Below shows the most commonly used parameters and kwargs of `pd.read_csv()`
data = pd.read_csv("abalone.data", sep=",", header=None, names=attr_names)
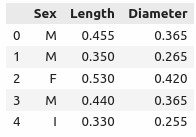
data

Output:


Sex	Length(mm)	Diameter(mm)	Height(mm)	Whole_weight(g)	Shucked_weight(g)	Viscera_weight(g)	Shell_weight(g)	Rings
0	M	0.455	0.365	0.095	0.5140	0.2245	0.1010	0.1500	15
1	M	0.350	0.265	0.090	0.2255	0.0995	0.0485	0.0700	7
2	F	0.530	0.420	0.135	0.6770	0.2565	0.1415	0.2100	9
3	M	0.440	0.365	0.125	0.5160	0.2155	0.1140	0.1550	10
4	I	0.330	0.255	0.080	0.2050	0.0895	0.0395	0.0550	7
...	...	...	...	...	...	...	...	...	...
4172	F	0.565	0.450	0.165	0.8870	0.3700	0.2390	0.2490	11
4173	M	0.590	0.440	0.135	0.9660	0.4390	0.2145	0.2605	10
4174	M	0.600	0.475	0.205	1.1760	0.5255	0.2875	0.3080	9
4175	F	0.625	0.485	0.150	1.0945	0.5310	0.2610	0.2960	10
4176	M	0.710	0.555	0.195	1.9485	0.9455	0.3765	0.4950	12
4177 rows × 9 columns
# Checking missing values in each column, a positive sum indicates the existence of missing entries in a given column
check_na = data.isna()
check_na.sum(axis=0)

Output:

Sex                  0
Length(mm)           0
Diameter(mm)         0
Height(mm)           0
Whole_weight(g)      0
Shucked_weight(g)    0
Viscera_weight(g)    0
Shell_weight(g)      0
Rings                0
dtype: int64
  • We don’t have any missing value in this abalone dataset.
  • As per the introductory page of the dataset, there are totally 9 attributes (columns), with 8 of them numerical.
  • The first column, Sex, is categorical. We might explore all its possible values via the value_counts() method.
categories = data["Sex"].value_counts()
categories

Output:

M    1528
I    1342
F    1307
Name: Sex, dtype: int64

Ex2.

# access a column using dict-like indexing
data["Sex"][0], data.Rings[2]

Output:

('M', 9)

Ex4.

  • Too much uniqueness of categorical values indicate that the amount of information that the feature carries is poor. We may safely exclude a feature if all its values are unique.
  • Manual or automatic concatenation of categories might be required.

I thank @Tejas-Garhewal for his/her instructive post on this question.

Ex5.

Here is the cute cat.png file used. :stuck_out_tongue:
cat

from PIL import Image
import numpy as np
img = Image.open("cat.png")
np.asarray(img)

Output:

array([[[199,  56, 130, 255],
        [199,  56, 130, 255],
        [199,  56, 130, 255],
        ...,
        [202,  68, 130, 255],
        [202,  68, 130, 255],
        [202,  68, 130, 255]],

       [[199,  56, 130, 255],
        [199,  56, 130, 255],
        [199,  56, 130, 255],
        ...,
        [202,  68, 130, 255],
        [202,  68, 130, 255],
        [202,  68, 130, 255]],

       [[199,  56, 130, 255],
        [199,  56, 130, 255],
        [199,  56, 130, 255],
        ...,
        [202,  68, 130, 255],
        [202,  68, 130, 255],
        [202,  68, 130, 255]],

       ...,

       [[233, 235, 236, 255],
        [233, 235, 236, 255],
        [233, 235, 236, 255],
        ...,
        [205, 206, 203, 255],
        [204, 206, 203, 255],
        [203, 206, 203, 255]],

       [[233, 235, 236, 255],
        [233, 235, 236, 255],
        [233, 235, 236, 255],
        ...,
        [205, 206, 203, 255],
        [205, 206, 203, 255],
        [204, 206, 203, 255]],

       [[233, 235, 236, 255],
        [233, 235, 236, 255],
        [233, 235, 236, 255],
        ...,
        [205, 206, 203, 255],
        [205, 206, 203, 255],
        [205, 206, 203, 255]]], dtype=uint8)

”“”Depending upon the context, missing values might be handled either via imputation or deletion . Imputation replaces missing values with estimates of their values while deletion simply discards either those rows or those columns that contain missing values.“”“

I think “imputation” should be changed to “Interpolation”.

I think the correct code for the pd.get_dummies function is the following:
inputs = pd.get_dummies(inputs,columns=['RoofType'],dummy_na=True)

Hi!
Link to Abalone dataset is broken. Here’s the correct one: